

For this simulation data from P.W. Bearman and J.K. Harvey1 has been used. The figures below were made, by using the data from the same article. For more information please refer to the article.
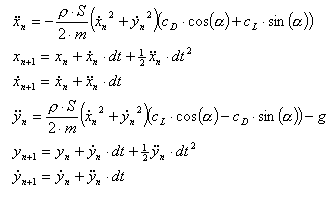
For each time step in this simulation, the acceleration, velocity and distance are calculated by the following equations (for n=0 to n=….. (until the ball hits the ground)):
 |
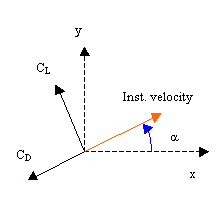 |
Where:
The results will be more accurate via the smallest step sizes. The simulation will also take more time, because of more calculations that has to be made. Here it also serves as a speed control of the animation.
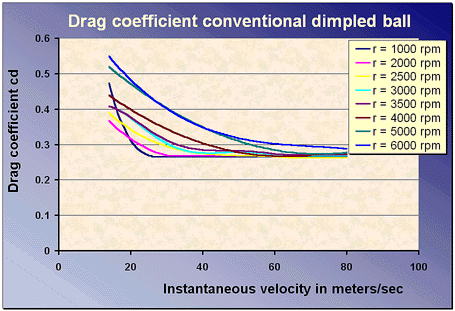
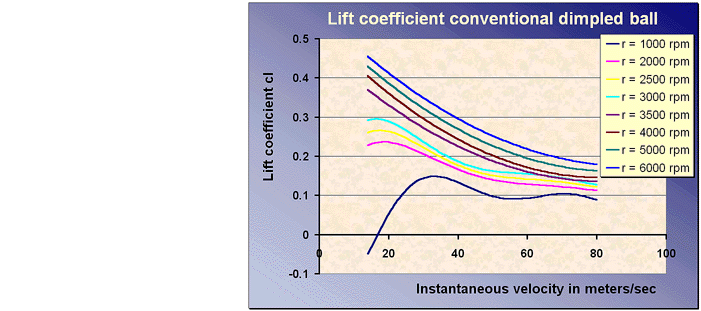
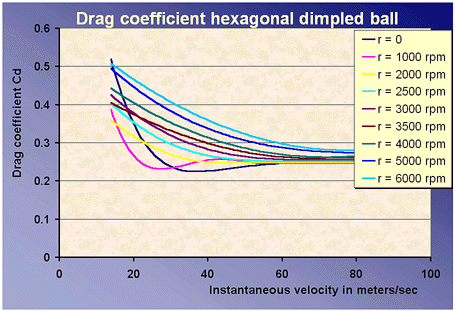
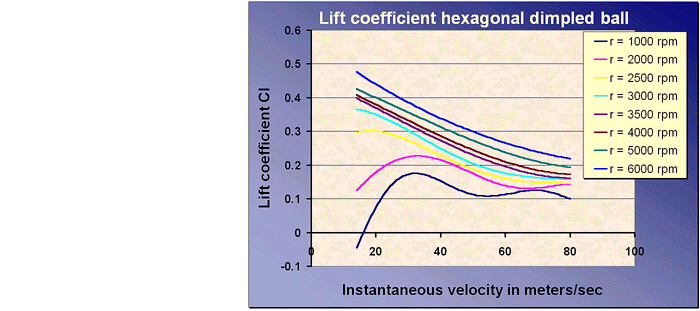
The data specified by Bearman and Harvey were put into figures by plotting the rotational speed versus the drag or the lift coefficients for different actual velocities. According to Bearman and Harvey, the rotational speed is almost constant during flight, so for the simulation we made curve fit equations of drag and lift coefficients versus instantaneous velocity for different constant rotational speeds. The equations been used, are plotted below in the figures (where r is rotational speed).
 |
 |
 |
 |
The data of drag coefficients and lift coefficients are only available for
speeds larger than 13 m/s. The speed of the ball will decrease during the
flight. Therefor if we want the simulated range to be accurate all the time,
launch velocities larger than 30 m/s must be used.
The simulated range versus launch velocity for constant rotational speed
and launch angle seems to be a linear line. However in reality the results
for velocities less than 30 m/s will curve to the point where zero-velocity
will cause a zero-range.
Backspin will produce a lift, which acts perpendicular to the initial speed.
The explanation of this phenomenon is discussed in the spinning ball site.
There is no data for the smooth ball available. Only for the conventional
dimpled ball and the hexagonal dimpled ball, the rotation of the ball can
be simulated.
For larger rotational speeds the lift will become higher. For little
instantaneous angles the lift will act for the most part in the y-direction.
But when the instantaneous angle becomes larger, the lift will also generate
a force in the negative x-direction. The lift will keep the ball longer in
the air, but the ball will be slowed down in the x-direction.
The drag for the dimpled balls is reduced for rotational speeds between 1000
and 4000 rpm for low instantaneous velocities. That will also affect the
range of the ball.
The graph shows therefore an optimum rotational speed, which causes the largest
range for constant launch velocity and launch angle. Of course, the lift
because of topspin will work in the other direction.
For small launch angles the ball will hit the ground very soon. By increasing the launch angle this will be delayed. But by increasing the angle, the launch velocity in x-direction will decrease. That is why there is also an optimum launch angle for the largest range.
1 P.W. Bearman and J.K. Harvey Golf ball aerodynamics, Aeronautical Quarterly, pp. 112 - 122, May 1976.