Fontana Simulations
|
|
Analyses of Fontana Dam were performed by the TVA
(#) and by the Cornell Fracture Group
(#). |
|
The TVA (#) used computer simulation to
determine two things: initial cause of cracking and where and how big to cut a
slot to help fix the cracking. They first modelled the entire dam to learn
about its behavior and learn what to expect from the model. Using this
information, they modelled only half of the dam. This decreased the
computation time and allowed them to concentrate on the half of the dam near
the cracking. |
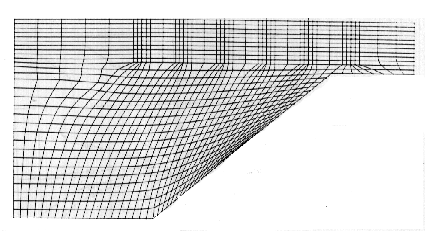
Model of half of the dam.
courtesy of the TVA |
|
Cornell researchers used computer simulations to try to recreate the cracking
in Fontana Dam.
The two dimensional model included part of the foundation of the dam.
|
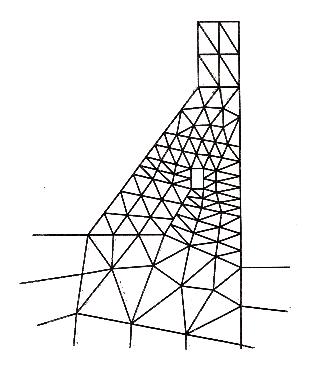
courtesy of A.R.
Ingraffea |
|
The weight of the dam and thermal expansion were applied as forces on the
dam in the computer simulation. The model was able to predict cracking very
close to the actual crack path. | 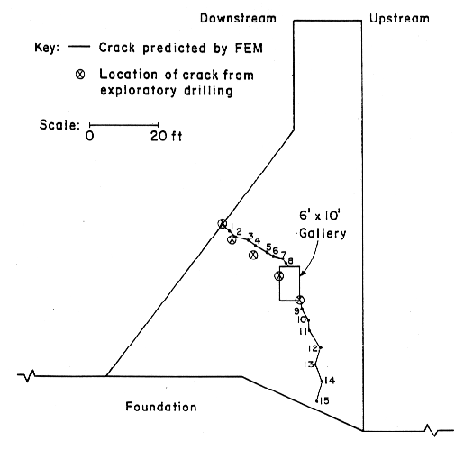 courtesy of A.R.
Ingraffea |
|
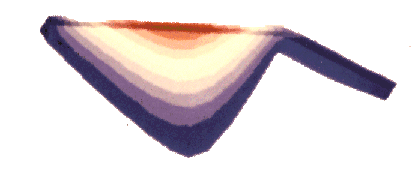
Three-dimensional analyses were used to determine the boundary
conditions for the two-dimensional analysis. Defining the boundary
conditions for this dam is difficult because of the curve of the dam.
This color contour shows the horizontal movement of the dam. Red indicates
the greatest movement horizontally, purple the least.
| 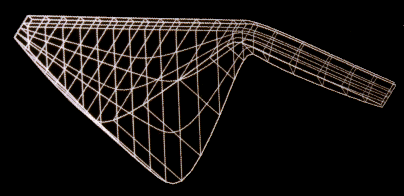  courtesy of A.R.
Ingraffea |


|


