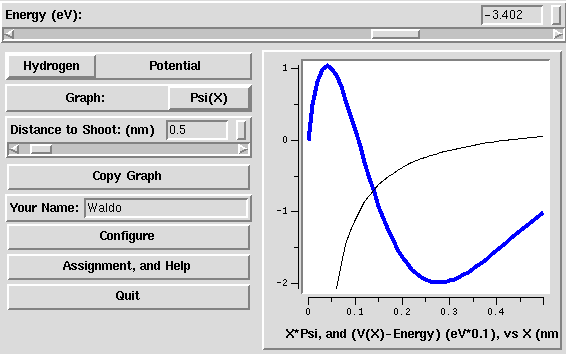
Graph Window:
The graph by default shows the wave-function , as a
function of position x (in nm). For the two square well potentials,
it can show either or the probability
distribution (see Graph below). For
the Hydrogen potential, it shows or its square,
where the three-dimensional Hydrogen electron wave-function
is given by (see
section 3 of the lab).
For the square-shelf potential, and for the Hydrogen potential, it also
shows the potential energy V(x), but somewhat rescaled: it
subtracts the energy of the wave-function, and multiplies by a factor
(default 0.1). Subtracting the energy E is useful because only
V(x)-E comes into the Schrödinger equation: in particular, the
wave function oscillates whenever V(x)-E < 0 and grows
or decays exponentially whenever V(x)-E > 0.
Energy:
On the top, there is a long slider which allows you to vary the energy.
As you change the energy, the graph is automatically updated with a
wave function at that energy.
You can vary the energy by
typing a new value in the box, and hitting Enter.
clicking beside the slider in the channel. This shifts the energy
by about 9% of its range.
pulling the slider. This will redraw the curve every time a
mouse motion is registered: it's great if you have a fast machine!
clicking on the little arrows. This is the fine control: it changes
the energy by 0.001.
The recommended method is to use the 9% jumps to get close to the value
you want, then pull the slider (zooming in as necessary) to get as close
as the graininess of the pixels lets you, then use the small arrows
to polish. Sometimes (particularly for the ground state of Hydrogen)
you'll find pulling the slider makes the curve jump too much, yet
clicking the arrows makes it jump too little: you then either have
to resort to typing in values (remember to hit Enter)
or you can click on the little box on the right-hand side of the slider
and change the configuration (either change the max and min, or
alter the increment, which will change the jumps from the arrows).
Sometimes you may want to get even closer than 0.001 in
energy: you'll have to either edit the numbers in the little box, or
alter the increment for the slider.
Potential Type:
There are three potentials for which schrdgr can solve the Schrödinger
equation:
Infinite Square Well (InfSquare): V(X) is
infinity for X < 0 and for X > Xshelf (default 1 nm).
Square Shelf (SquareShelf): V(x) is infinite
for X < 0, and equals Vshelf (default 3eV) for X > Xshelf.
Hydrogen (Hydrogen): Here X represents the distance
of the electron to the Hydrogen nucleus. Of course, hydrogen is a
three-dimensional atom, and we're solving Schrödinger's equation in
one dimension. However, it turns out that some of the solutions
of the time-independent equation in three dimensions can be written
in terms of solutions of the equation in one dimension (see
section three of the lab). Note:
X < 0 is meaningless; the distance to the proton can't be
less than zero!
We're plotting r times the wave function (see
the lab).
so the normalization isn't right (this doesn't matter for us...)
Graph:
Choose either
the wave function , or
the probability distribution .
They are normalized to one,
but only including the range plotted (zero to Xmax). For
Hydrogen, is used instead
of , and the normalization is not correct (see Hydrogen
above).
Distance to Shoot:
This allows you to change the range of the X-axis (zero to Xmax) on the graph.
Increasing the distance is important for Hydrogen and the Square Shelf, if you
want to get good accuracy (large ranges are very fussy, but the
right energy is determined by the behavior at very large X, and the
larger you investigate, the better you can do), or
want to explore higher eigenstates (which spill over into larger X).
For the infinite square well, increasing the range doesn't make sense.
Copy Graph
allows you to capture a plot; you can then combine plots, print plots,
save trajectories, ...
Your Name
Type your name in here, so that your graphs are labelled correctly.