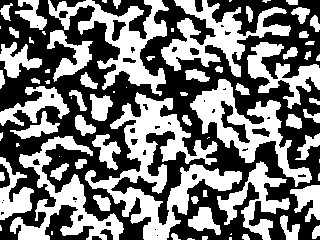
Demagnetize the sample by running briefly at H = 0 and T = 10 (or hit
T=inf). Now set T below T_c (say, T=0) and let it run. Describe how the
pattern changes with time. (As the pattern develops, the changes occur
more slowly and you may want to increase "Sweep Increment" using the
configure button to 10 or more.) By
- measuring on the screen by eye,
- by writing a subroutine to measure correlation functions and finding
the half-maximum, or
- using the energy as a measure of the total
length of the surface between spin up and spin down regions (valid only
at low temperature),
find the typical size L(t) of the red and white
domains, and graph it versus time. What power law do we expect it to
grow with? Does it grow as expected? When do finite-size effects start
changing things?
Other Ising Model Presets
- Description of the Model.
- Phase Diagram
- Magnetization M(T)
- Nucleation
- Domain Coarsening
Last modified: June 1, 1997
James P. Sethna, sethna@lassp.cornell.edu,
https://sethna.lassp.cornell.edu/sethna.html
 Statistical Mechanics: Entropy, Order Parameters, and Complexity,
now available at
Oxford University Press
(USA,
Europe).

![]() Statistical Mechanics: Entropy, Order Parameters, and Complexity,
now available at
Oxford University Press
(USA,
Europe).
Statistical Mechanics: Entropy, Order Parameters, and Complexity,
now available at
Oxford University Press
(USA,
Europe).