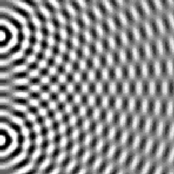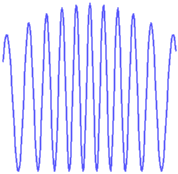


Remember that the sources are along the edge X=0, the screen is along X=X Screen, and measures intensity or amplitude along constant Z, for varying Y.
Measure the distance in Y from the central maximum to the first (You can change the screen size to around 30, and then zoom in with the mouse. You should be able to measure it to at least three significant figures.) Write the answer in your lab write-up.
Give the formula which tells where you expect the waves from the two sources to interfere constructively, in terms of d, X Screen, and Lambda. Include this formula in your write-up. Using the small angle approximation, evaluate the distance you theoretically expect between the central peak and the first side peak, and compare with the distance you measured.
Now reset the Screen size to 300 m. Notice that the peaks are not equally spaced (unlike the prediction of the small-angle theoretical prediction). Find the position of the seventh peak from the center, to three significant figures or more. Include it in your lab write-up. Now calculate the theoretical prediction, with and without making the small angle approximation. Compare the three in your write-up. Is the varying distance between the peaks due to large values of the angle?
Vary d and Lambda. Convince yourself that you understand, whether the distance between peaks increases or decreases when you increase these parameters. (It's important that you have a gut feeling for diffraction: formulas aren't enough.) Write down whether the distance between peaks on the screen varies proportionately or inversely with d and with Lambda.
Vary the screen position X Screen inward and outward by a factor of ten. How much does the intensity at the peak Y=0 change? Write down your measurements. Give a formula with your guess as to how the intensity varies with distance.
We can understand this in a simple way. If energy is conserved, and if it doesn't keep building up in a region, then the average flow into the region must equal the average flow out. Consider the region between radius R1 and radius R2. The average energy per second passing through a radius R must equal that passing through R'. Since the intensity times the circumference is the energy per second, the intensity must go as one over the circumference. Compare this theoretical prediction with your measurements. A similar argument works for the intensity from a light-bulb or from the Sun, except that there the energy is spread over a sphere instead of a circle. With what exponent of R will the intensity decay for the Sun?
Finally, as an optional problem, measure the decay of intensity as a function of Y for a fixed screen position, and compare with the decay expected from the increasing distance of the screen from the source. What is the formula giving the decay as a function of theta?
If d=6, and the screen is set at a distance 8m away, how far is the point Y=3 from the upper source? How far is it from the lower source? (Use the Pythagorean theorem for 3-4-5 triangles.) For what largest value of Lambda will the waves from these two sources interfere constructively? What's the largest value of Lambda for destructive interference at Y=3? Include these predicted values in your write-up.
Set Lambda=4, and locate the point Y=3, X=8. Does it have destructive or constructive interference? (Remember, destructive interference means the amplitude of the wave is zero, which yields grey on the wave-tank.) Vary the phase, and make sure the color stays grey as the waves fly past.
You can get a more accurate reading using the screen. Move the screen to X Screen=8 m, and shrink the screen size to 10m. Vary Lambda, and test if your predictions for constructive and destructive interference are correct!
It's also easy to figure out where the interference is destructive near X=0. If Lambda=4, at which points along the line between the two sources will they interfere destructively? Write your predictions in your write-up. Check using the screen and using the wave-tank, and note to how many decimals they agree with your prediction.
We can visualize the curves of destructive interference. Use the configure... button to make the wave-tank size L=30, keeping Lambda=4 and d=6. You can see that the grey line showing the interference minimum aims to the midpoint between the two sources, but that it curves away near X=0. Put the screen back at X Screen=100, and compare d sin(theta) with Lambda/2 at the minimum. How well do they agree?
We should note that, at large angles theta, the effects of increasing distance from the screen discussed in problem H1b will distort the positions of the maxima of the interference patterns away from those predicted by constructive interference. (The maxima will shift in a bit, to get closer to the source!) At large distances the entire pattern is multiplied by cos(theta): this shifts the maxima but doesn't change the zeros. Thus d sin(theta) = (m+1/2) Lambda is correct for the zeros even at large theta, but d sin(theta) = m Lambda, the formula for constructive interference, gives the positions of the maxima perfectly only for small theta.
![]() Statistical Mechanics: Entropy, Order Parameters, and Complexity,
now available at
Oxford University Press
(USA,
Europe).
Statistical Mechanics: Entropy, Order Parameters, and Complexity,
now available at
Oxford University Press
(USA,
Europe).