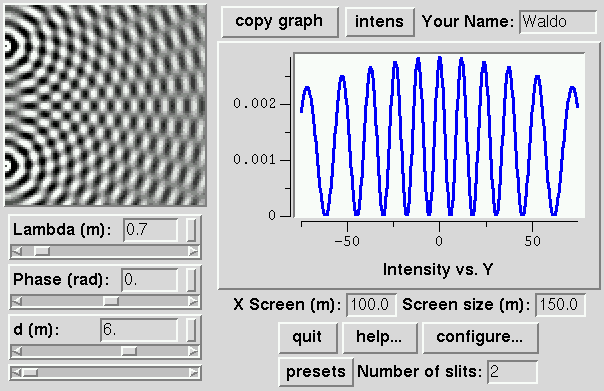

The sources are at X=0 and Y=+d/2 and Y=-d/2, where d is determined by the third slider: they extend to infinity along the Z direction. Thus X is the horizontal axis and Y is the vertical axis in the wave tank at right; the screen on the left lies at X_Screen (far to the right of the wave tank view) and shows the average intensity along Y. The slits are long and thin in the Z direction. Try varying d. The wave tank shows a L x L region of the XY plane, where the default value for L is 10m. The wavelength of the waves is set by the slider marked Lambda, and the Phase is set by the next slider. Try varying Lambda and Phase. If Lambda gets too small, you get weird effects because of the grid spacing in the wave tank. The width of the slits is given by a. Try varying it. The program will run fastest with a=0.
On the right, you should see what's happening on a screen far away. The ripple pattern on the left is the XY plane, with two sources along X=0; the screen is located far from the sources in the YZ plane at a distance X_Screen which to start with is at X=100m. The default should show the average intensity versus Y along the line Z=0. The regions of constructive interference form peaks in the intensity: at places where the interference is destructive, the intensity goes to zero.
What's shown on the screen at right is not the same as what's shown in the wave tank at left! First, the intensity is the square of the amplitude. But second, we've shown the average intensity over many cycles of the wave! Try the preset called ``Amplit''. This shows just one thin slit, so the wave tank has a single set of circular ripples. The preset changes the plot, so it shows the amplitude of the wave at the screen rather than the average intensity. Also, the preset ``Amplit'' changes the position and width of the screen to lie just at the right border of the wave tank (shrinking X_Screen to 10 and plotting from -5<Y<5). Now, the high regions on the screen should be white in the wave tank, and the dark regions along the right boundary of the tank should be low (most negative) on the screen. Is that right? Try changing the phase, and watch the waves crash on the shore. Now try switching the menu back from ``amplit'' to ``intens''. This is not just the square of the amplitude: it's the average intensity over time (which is the same as the average over different phases of the wave, since the phase increases linearly in time). Try varying the phase, and see that the average intensity doesn't change.
In the next sections, we get quantitative about interference and diffraction.
![]() Statistical Mechanics: Entropy, Order Parameters, and Complexity,
now available at
Oxford University Press
(USA,
Europe).
Statistical Mechanics: Entropy, Order Parameters, and Complexity,
now available at
Oxford University Press
(USA,
Europe).