|
|
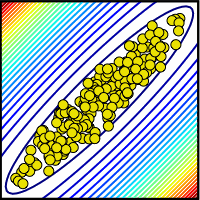
| Parameter ensemble consistent with collective data. Often predictions can be made long before the parameters are determined. |
|
|
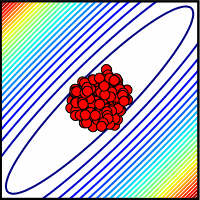
| Ensemble consistent with measured parameters. Here all parameters have small errors. |
|
|
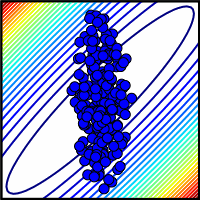
| Ensemble consistent with all but one parameter measured. Many contours (representing collective model behavior) are crossed if even one parameter is missed. |
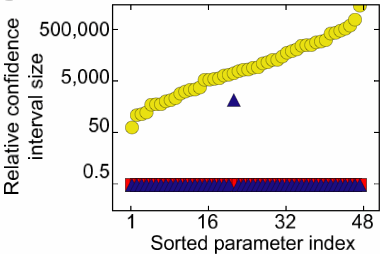
We have discovered that multiparameter models are often sloppy: enormous ranges of parameters can be used to fit the same data, and often predictions can be made long before the parameters are even qualitatively determined. (This happens because sloppy combinations of parameters can vary over wide ranges without changing model behavior: yellow dots at right). One can view this as a good or a bad thing. On the one hand, it makes it easier to prove the model is wrong - a key goal for experimentalists. On the other hand, it makes it challenging to prove that the model is correct. Perhaps one is fitting the existing behavior, but for the wrong reason?
One can of course design special experiments to measure one parameter at a time (avoiding the collective behavior of the model as a whole). If we did measure all of the parameters (red dots at right), and the model still fit the data, then we could be far more confident that the model was really correct - that there were no important missing links or reaction pathways, that were fit by fiddling (or renormalizing) the existing model parameters.
My biology collaborators, though, usually test models not by measuring all the parameters, but by changing the system in a drastic way: knocking out a gene, overexpressing a protein, or inhibiting a reaction with a drug (as we describe below). Measuring parameters is considered boring. In fact, the models in biology are usually works in progress: new links and pathways and important features are expected. Perhaps it is an asset that a sloppy model can make predictions about a complex model that are consistent with existing behavior and understanding? Models are useful even when proven wrong, if being wrong tells us something new.
Is measuring parameters useful? In particular, suppose (as is usually the case) it is not feasible
to measure every last parameter. Can one extract predictions from models when only half of the parameters
are measured? How about all but one parameter? Indeed, for sloppy models, one might expect that even
one missed parameter could make for drastic problems. The blue dots at right show a schematic
view of a system where one parameter wasn't well measured. Here the range of the unmeasured parameter
crossed many contours, representing model behavior. In a sloppy system, where the aspect ratios
of the contours are a thousand to one or more, we might expect that missing even one parameter could
keep one from making useful predictions.

|
| Protein interaction network describing the reaction of PC12 cells to two growth hormones (EGF and NGF). The model has 48 unknown parameters. |
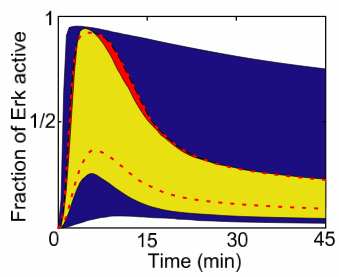
We tested this idea using our systems biology model (left) for the response (active Erk versus time) of a certain cell to a particular growth hormone (EGF). If Erk goes down after 10 minutes, the cell proliferates (reproduces); if it stays up the cell differentiates (grows branches like a neuron). We wanted to determine what would happen if we fed the cell a drug (LY, red X) that would turn off the effects of two of the proteins (the "left wing" colored in gray). There were four styles of predictions we used.
|
|
What about trying to measure most of the parameters, and fit the ones that are hard to measure? We haven't tested this, but we expect that the (experimentally challenging) parameter measurements might turn out to be unimportant. Fitting data is so powerful, that predictions might be almost as precise if one fit all the parameters (instead of just the unmeasured ones).
Are we advocating laziness? Certainly a few experiments measuring collective behavior are easier than specific experiments measuring each parameter, and boldly making predictions before parameters are known is easier than measuring until the parameters become determined. But we replace experimental rigor with computational rigor. We believe that model predictions should always be accompanied by an error analysis (like in the figure at left). Since the parameters are so often poorly determined by the data, one must not believe the results of the simulation until one also checks the range of behaviors allowed by the data - running simulations covering the huge, sloppy range in parameter space.
Our conclusion? Sloppy systems have a weird connection between parameters and model behavior. Not
only can't you use the behavior of the model to determine the parameters, but conversely a partial
knowledge of the parameters is useless at making predictions about model behavior. The biologists
are right: measuring parameters is boring, if your system is sloppy.
James P. Sethna, sethna@lassp.cornell.edu; This work supported by the Division of Materials Research of the U.S. National Science Foundation, through grant DMR-070167.
 Statistical Mechanics: Entropy, Order Parameters, and Complexity,
now available at
Oxford University Press
(USA,
Europe).
Statistical Mechanics: Entropy, Order Parameters, and Complexity,
now available at
Oxford University Press
(USA,
Europe).