
|
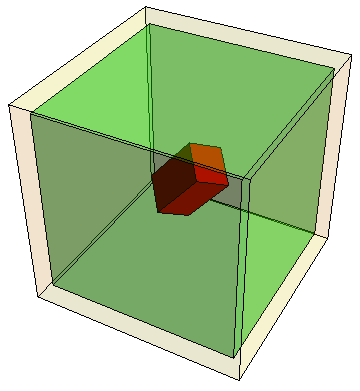
| Naive versus sloppy volumes. The outer cube beige represents a 3D projection of the 48-dimensional cube of sampled parameters. The inner green cube has 1/200 the volume of the outer one (when the other 45 dimensions are included). The tilted red brick schematically represents the stiffest three eigenvalues, scaled so that the volume of the 48-dimensional sloppy brick inside the sampled parameter cube is also 1/200. |
One of the key recent themes of systems biology is robustness. For many models of biological networks, the behavior is remarkably insensitive to changes in the parameters ('mutational' or parameter robustness as opposed to environmental robustness). But is mutational robustness a deep truth about biological fitness (fewer children dying from mutations), or is it a natural mathematical consequence of interacting proteins and genes? After all, we've found that most of these systems biology models are sloppy - naturally dependent only on four or five combinations of parameters, with all of the other parameter directions sloppy and unimportant.
Many of the papers on parameter robustness study the development of fruit fly embryos (the Drosophilia segment polarity gene network). The original paper noted that random choices for the 48 parameters over substantial ranges (roughly three decades each) gave a roughly 1/200 chance of patterning correctly (preserving the phenotype).
Why does that sound so robust? One half of one percent seems like a small number, unless you consider that a 48 dimensional space is huge. Consider the cube giving the range of parameters sampled (beige outer cube at right). To reduce the volume of the cube by a factor of 200, one needs to reduce each side by 1/2001/48 ~ 90% (green inner cube). A factor of 200, split between 48 different parameters, now seems amazingly small.

|
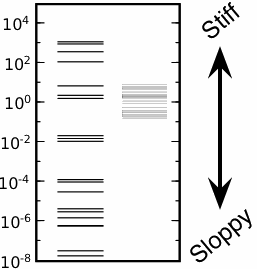
| Segment polarity model is sloppy (left) and robust (right). Left: Eigenvalues λi of the Hessian of the segment polarity model. Right: Corresponding PCA eigenvalues phenotype-preserving parameters in the sampled region; the total range of 100 implies that the width of the stiffest direction in parameter space is only a factor of ten thinner than the sampled box. |
But we know that systems biology models are sloppy. In fact, the fruit fly embryo model is sloppy: the left column of levels on the figure at left show the eigenvalues about the best fit (with about thirty more even smaller eigenvalues). The "width" in parameter space in which the behavior of a sloppy model is unchanged is proportional to one over the square root of the eigenvalue. So, all but a few stiff directions are automatically unimportant for the segment polarity network.
In the spirit of the cube-in-cube robustness argument above, let's construct a sloppy brick of width R/√λi for each eigenvalue λi. Many directions of the brick will be a thousand or more times thicker than the stiffest direction, spanning well outside of the beige cube. If we set R so that the part of the brick that lies inside is 1/200 of the sampled region, all but the four stiffest directions spill outside. The cube figure above shows the span of the three stiffest directions; the brick in the fourth dimension is about half the length of the cube. We've rotated the brick to remind ourselves that the stiff eigendirections are combinations of parameters - but the figure remains misleading, because the brick should be rotated in all 48 dimensions!
In this picture, the 1/200 factor in the robustness seems much less amazing. Because the system is sloppy, 44 of the 48 dimensions are sloppy, and thus "automatically" robust. There is a bit more to the story, though.
Sloppiness measures the entire dynamical behavior of the model (not just the phenotype, but what we call the dynatype). So, while we know that the sloppy directions can't matter to the phenotype, we don't know that the stiff directions do matter. Can we test this?
We checked this by doing our own sampling of the model, and looking at the widths of the "robust" region where the embryo patterns correctly using a technique called PCA (principal components analysis), shown as the right column in the figure next to our plotted eigenvalues. If our sloppy model analysis perfectly described the region, the PCA should have given four stiff eigenvalues spaced like the top four lines, and then a bunch clustered together giving the sizes of the cube.
So, sloppiness explains why "44 out of 48" dimensions in parameter space are robust. To explain parameter robustness in a model, our job is now much easier - we only need to understand why a few stiff parameter directions, which do change the internal dynamics of the model (dynatype), don't affect the overall behavior (phenotype).
James P. Sethna, sethna@lassp.cornell.edu; This work supported by the Division of Materials Research of the U.S. National Science Foundation, through grant DMR-070167.
![]() Statistical Mechanics: Entropy, Order Parameters, and Complexity,
now available at
Oxford University Press
(USA,
Europe).
Statistical Mechanics: Entropy, Order Parameters, and Complexity,
now available at
Oxford University Press
(USA,
Europe).