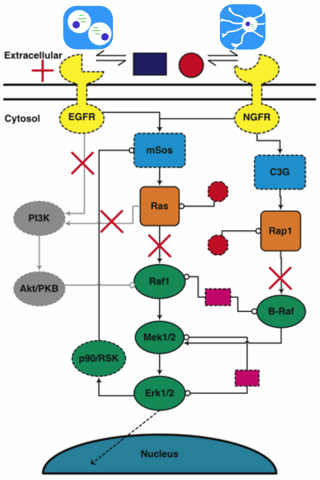
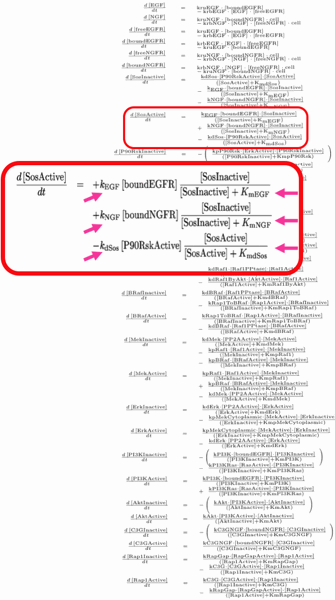
Some years back, Colin Hill (then a Physics graduate student of mine, now CEO of Gene Network Sciences) got interested in biology. He dragged me out to talk with Rick Cerione (then in Molecular Medicine at the Vet college) and his student Guillermo Calero about how proteins interact to transmit signals inside cells (and how, when they mutate, cells can become cancerous). Another student, Kevin Brown, soon got involved, and we stumbled onto the existence of sloppy models...
I figured that we'd never be able
to extract 48 parameters from fitting the data. Rick Cerione, though,
expected that we'd be able to make predictions anyway. Always before,
he could make predictions in his head! With a computer we ought to be
able to include a few more feedback loops?
|
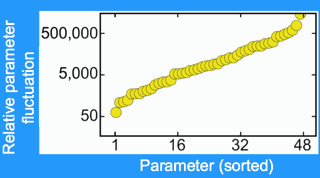
| Huge parameter variations. The factor by which each parameter varies, with parameters sorted in increasing order. Every parameter varies by more than a factor of fifty. Will predictions be possible? |
We could fit to the data and make predictions, but with 48 free parameters
could we trust our answers? To see if an answer was trustworthy, we did
statistical mechanics in model space. (Doing a Monte Carlo in parameter
space, it turns out, is called stochastic Bayesian analysis.)
As I had suspected, the parameters varied over huge ranges. In fact,
every parameter varied by over a factor of fifty, and many varied over
factors of many thousands. Remember - all of these parameter sets
still fit the existing experimental data.
|
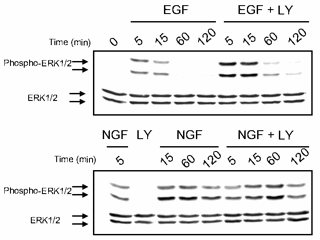
|
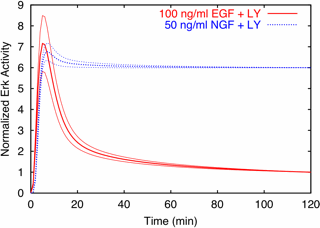
| Predictions are possible, even with huge uncertainties in all parameters. Predicted time evolution of activated Erk after stimulation with growth hormones EGF and NGF, after PI3K is inactivated by the use of the drug LY. Notice that the uncertainties are only a few percent, even though the uncertainty in every parameter individually is larger than a factor of fifty! | Prediction verified by experiment. The key part of this Western blot are the blots in the upper right (in the row Phospho-ERK1/2, column EGF+LY). The blots are dark (lots of Erk activity) at 5 and 10 minutes, and then grow light, just as for the prediction, red curve at left. The blue curve at left corresponds to the column NGF+LY, which indeed stay dark (active) all the way to 120 minutes. |
James P. Sethna, sethna@lassp.cornell.edu; This work supported by the Division of Materials Research of the U.S. National Science Foundation, through grant DMR-070167.
![]() Statistical Mechanics: Entropy, Order Parameters, and Complexity,
now available at
Oxford University Press
(USA,
Europe).
Statistical Mechanics: Entropy, Order Parameters, and Complexity,
now available at
Oxford University Press
(USA,
Europe).