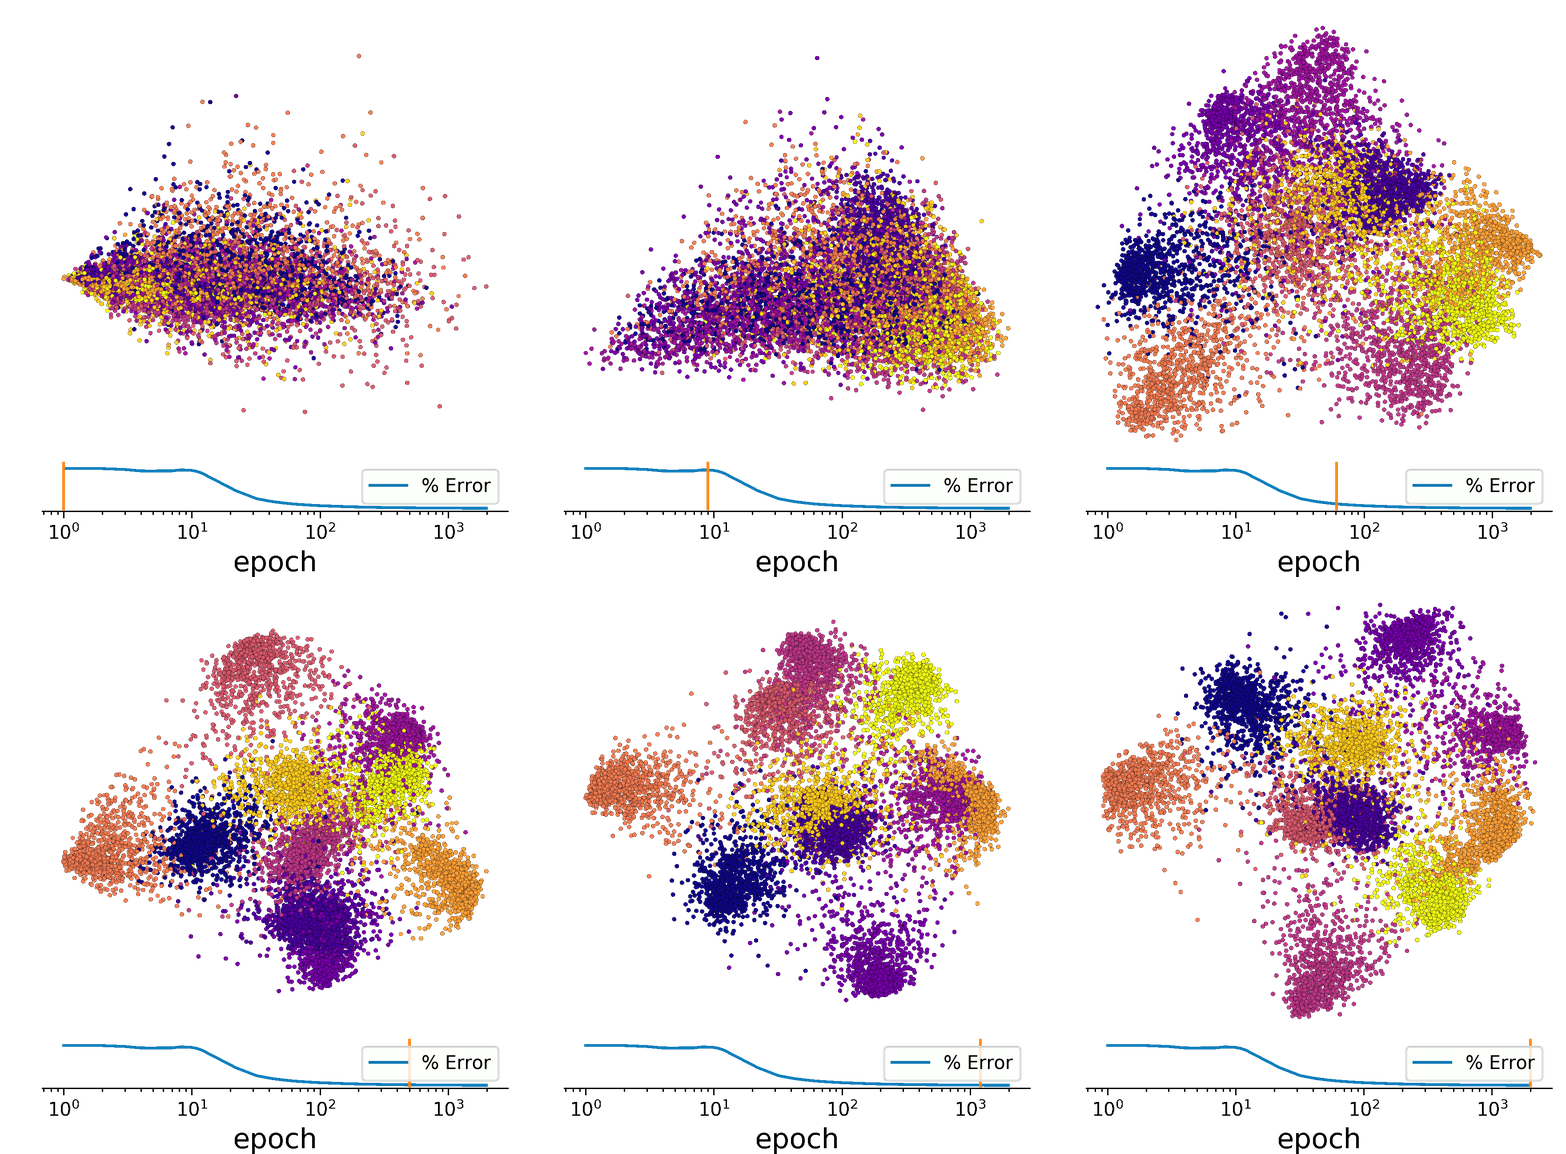
Stages of training a convolutional neural network (CNN). Each point in this animation represents one of the 10,000 handwritten digits in the MNIST test data set. Each of the ten colors represents one of the ten digits (dark blue = 0, ..., yellow = 9, see summary figure below). The time evolution, or epoch, reflects the training of the neural network. At the initial frame, the untrained network is unable to classify images -- it has a 90% error rate, just as one would expect from random guessing. As the training progresses and the error rate decreases, the digits in the cloud begin to cluster. (The network was trained on a separate set of 55,000 images, so the clustering represents success in recognizing new digits.)
This animation makes use of a new tool, InPCA, for visualizing high-dimensional data (see Visualizing probabilistic models: Intensive Principal Component Analysis, by Katherine N. Quinn, Colin B. Clement, Francesco De Bernardis, Michael D. Niemack, and James P. Sethna.) Our method bypasses the `curse of dimensionality' that arises for large models with too much information by taking the limit of zero information using the 'replica trick'.
Summary figure, showing digits.
James P. Sethna, sethna@lassp.cornell.edu; This work supported by the Division of Materials Research of the U.S. National Science Foundation, through grant DMR-1719490.
![]() Statistical Mechanics: Entropy, Order Parameters, and Complexity,
now available at
Oxford University Press
(USA,
Europe).
Statistical Mechanics: Entropy, Order Parameters, and Complexity,
now available at
Oxford University Press
(USA,
Europe).